Showing posts with label visualization. Show all posts

22 February 2015

Drawing a Manhattan plot in SVG using a GWAS+XML model.

On friday, I saw my colleague @b_l_k starting writing SVG+XML code to draw a Manhattan plot. I told him that a better idea would be to describe the data using XML and to transform the XML to SVG using XSLT.


So, let's do this. I put the XSLT stylesheet on github at https://github.com/lindenb/xslt-sandbox/blob/master/stylesheets/bio/manhattan.xsl . And the model of data would look like this (I took the data from @genetics_blog's http://www.gettinggeneticsdone.com/2011/04/annotated-manhattan-plots-and-qq-plots.html ) .


<?xml version="1.0"?>
<manhattan>
  <chromosome name="1" length="1500">
    <data rs="1" position="1" p="0.914806043496355"/>
    <data rs="2" position="2" p="0.937075413297862"/>
    <data rs="3" position="3" p="0.286139534786344"/>
    <data rs="4" position="4" p="0.830447626067325"/>
    <data rs="5" position="5" p="0.641745518893003"/>
 (...)
  </chromosome>
  <chromosome name="22" length="535">
    <data rs="15936" position="1" p="0.367785102687776"/>
    <data rs="15937" position="2" p="0.628192085539922"/>
(...)
    <data rs="1" position="1" p="0.914806043496355"/>
  </chromosome>
</manhattan>

The stylesheet


At the beginning , we declare the size of the drawing


<xsl:variable name="width" select="number(1000)"/>
<xsl:variable name="height" select="number(400)"/>

we need to get the size of the genome.


<xsl:variable name="genomeSize">
    <xsl:call-template name="sumLengthChrom">
      <xsl:with-param name="length" select="number(0)"/>
      <xsl:with-param name="node" select="manhattan/chromosome[1]"/>
    </xsl:call-template>
</xsl:variable>

We could use the xpath function 'sum()' but here I the user is free to omit the size of the chromosome. It this attribute '@length' is not declared, we use the maximum position of the SNP in this chromosome:


<xsl:template name="sumLengthChrom">
    <xsl:param name="length"/>
    <xsl:param name="node"/>
    <xsl:variable name="chromlen">
      <xsl:apply-templates select="$node" mode="length"/>
    </xsl:variable>
    <xsl:choose>
      <xsl:when test="count($node/following-sibling::chromosome)&gt;0">
        <xsl:call-template name="sumLengthChrom">
          <xsl:with-param name="length" select="$length + number($chromlen)"/>
          <xsl:with-param name="node" select="$node/following-sibling::chromosome[1]"/>
        </xsl:call-template>
      </xsl:when>
      <xsl:otherwise>
        <xsl:value-of select="$length + number($chromlen)"/>
      </xsl:otherwise>
    </xsl:choose>
  </xsl:template>

we get the smallest p-value:


<xsl:variable name="minpvalue">
    <xsl:for-each select="manhattan/chromosome/data">
      <xsl:sort select="@p" data-type="number" order="ascending"/>
      <xsl:if test="position() = 1">
        <xsl:value-of select="number(@p)"/>
      </xsl:if>
    </xsl:for-each>
  </xsl:variable>

then we plot each chromosome, the xsl parameter "previous" contains the number of bases already printed.
We use the SVG attribute transform to translate the current chromosome in the drawing


<xsl:template name="plotChromosomes">
    <xsl:param name="previous"/>
    <xsl:param name="node"/>
(...)
      <xsl:attribute name="transform">
        <xsl:text>translate(</xsl:text>
        <xsl:value-of select="(number($previous) div number($genomeSize)) * $width"/>
        <xsl:text>,0)</xsl:text>
      </xsl:attribute>

we plot each SNP:


<svg:g style="fill-opacity:0.5;">
        <xsl:apply-templates select="data" mode="plot"/>
      </svg:g>

and we plot the remaining chromosomes, if any :


<xsl:if test="count($node/following-sibling::chromosome)&gt;0">
      <xsl:call-template name="plotChromosomes">
        <xsl:with-param name="previous" select="$previous + number($chromlen)"/>
        <xsl:with-param name="node" select="$node/following-sibling::chromosome[1]"/>
      </xsl:call-template>
    </xsl:if>

to plot each SNP, we get the X coordinate in the current chromosome:


<xsl:template match="data" mode="x">
    <xsl:variable name="chromWidth">
      <xsl:apply-templates select=".." mode="width"/>
    </xsl:variable>
    <xsl:variable name="chromLength">
      <xsl:apply-templates select=".." mode="length"/>
    </xsl:variable>
    <xsl:value-of select="(number(@position) div number($chromLength)) * $chromWidth"/>
  </xsl:template>

and the Y coordinate:


<xsl:template match="data" mode="y">
    <xsl:value-of select="$height - (( (math:log(number(@p)) * -1 ) div $maxlog2value ) * $height )"/>
  </xsl:template>

we can also wrap the data in a hyperlink if a @rs attribute exists:


<xsl:choose>
      <xsl:when test="@rs">
        <svg:a target="_blank">
          <xsl:attribute name="xlink:href">
            <xsl:value-of select="concat('http://www.ncbi.nlm.nih.gov/projects/SNP/snp_ref.cgi?rs=',@rs)"/>
          </xsl:attribute>
          <xsl:apply-templates select="." mode="plotshape"/>
        </svg:a>
      </xsl:when>
      <xsl:otherwise>
        <xsl:apply-templates select="." mode="plotshape"/>
      </xsl:otherwise>
    </xsl:choose>

we plot the SNP itself, as a circle:


<xsl:template match="data" mode="plotshape">
    <svg:circle r="5">
      <xsl:attribute name="cx">
        <xsl:apply-templates select="." mode="x"/>
      </xsl:attribute>
      <xsl:attribute name="cy">
        <xsl:apply-templates select="." mode="y"/>
      </xsl:attribute>
    </svg:circle>
  </xsl:template>

Result:


$ xsltproc manhattan.xsl model.xml > plot.svg

Plot


That's it
Pierre

30 October 2014

Visualizing @GenomeBrowser liftOver/chain files using animated #SVG

I wrote a tool to visualize some UCSC "chain/liftOver" files as an animated SVG file. This tool is available on github at:

"A liftOver file is a chain file, where for each region in the genome the alignments of the best/longest syntenic regions are used to translate features from one version of a genome to another.".

SVG Elements and CSS styles can be animated in a SVG file (see http://www.w3.org/TR/SVG/animate.html ) using the <animate/> element.

For example the following SVG snippet

  • defines a rectangle(x=351,y=35,width=6,height=5).
  • at t=60secs the opacity will change from 0 to 0.7 for 2secs
  • the position 'x' will move from x=351 to x=350 starting at t=62secs for 16 seconds
  • the position 'y' will move from y=35 to y=36 starting at t=62secs for 16 seconds
  • the 'width' will grow from width=6 to width=100 starting at t=62secs for 16 seconds
  • at t=78secs the opacity will change from 0.7 to 0 for 2secs
<rect x="351" y="35" width="6" height="15">
        <animate attributeType="CSS" attributeName="opacity" begin="60" dur="2" from="0" to="0.7" repeatCount="1" fill="freeze"/>
        <animate attributeType="XML" attributeName="x" begin="62" dur="16" from="351" to="350" repeatCount="1" fill="freeze"/>
        <animate attributeType="XML" attributeName="y" begin="62" dur="16" from="35" to="36" repeatCount="1" fill="freeze"/>
        <animate attributeType="XML" attributeName="width" begin="62" dur="16" from="6" to="100" repeatCount="1" fill="freeze"/>
        <animate attributeType="CSS" attributeName="opacity" begin="78" dur="2" from="0.7" to="0" repeatCount="1" fill="freeze"/>
</rect>

A demo hg16-hg17-hg18-hg19-hg38 was posted here: http://cardioserve.nantes.inserm.fr/~lindenb/liftover2svg/hg16ToHg38.svg


That's it,

Pierre.

05 July 2014

Pushed : makefile2graph , creating a graph of dependencies from GNU-Make.

I pushed makefile2graph at https://github.com/lindenb/makefile2graph. This is the standalone and 'C' implementation of a program I first wrote in java in 2012. The program creates a graph of dependencies from GNU-Make and its output is a graphiz-dot file or a Gexf/Gephi-XML file.

Usage

$ make -Bnd | make2graph > output.dot
$ make -Bnd | make2graph -x > gephi.gexf.xml 

Example

Here is the output of makefile2graph for Tabix:
$ cd tabix-0.2.5
$ make -Bnd |make2graph
digraph G {
n1[label="", color="green"];
n2[label="Makefile", color="green"];
n4[label="all", color="red"];
n3[label="all-recur", color="red"];
n23[label="bedidx.c", color="green"];
n22[label="bedidx.o", color="red"];
n9[label="bgzf.c", color="green"];
n10[label="bgzf.h", color="green"];
n8[label="bgzf.o", color="red"];
n27[label="bgzip", color="red"];
n29[label="bgzip.c", color="green"];
n28[label="bgzip.o", color="red"];
n18[label="index.c", color="green"];
n17[label="index.o", color="red"];
n20[label="khash.h", color="green"];
n16[label="knetfile.c", color="green"];
n11[label="knetfile.h", color="green"];
n15[label="knetfile.o", color="red"];
n24[label="kseq.h", color="green"];
n21[label="ksort.h", color="green"];
n13[label="kstring.c", color="green"];
n14[label="kstring.h", color="green"];
n12[label="kstring.o", color="red"];
n6[label="lib", color="red"];
n7[label="libtabix.a", color="red"];
n26[label="main.c", color="green"];
n25[label="main.o", color="red"];
n5[label="tabix", color="red"];
n19[label="tabix.h", color="green"];
n2 -> n1 ; 
n4 -> n1 ; 
n3 -> n1 ; 
(..)
}

That's it
Pierre

12 July 2013

Inside the Variation Toolkit: Gene Ontology for VCF, GUI for VCF

A quick note about three java-based tools for VCF files I wrote today.

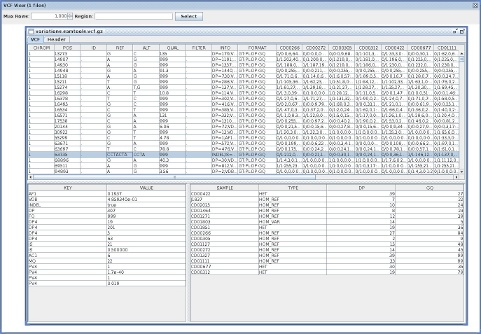
VcfViewGui

VcfViewGui : a Simple java-Swing-based VCF viewer.


VCFGeneOntology

vcfgo reads a VCF annotated with VEP or SNPEFF, loads the data from GeneOntology and GOA and adds a new field in the INFO column for the GO terms for each position.
Example:
$ java -jar dist/vcfgo.jar I="https://raw.github.com/arq5x/gemini/master/test/tes.snpeff.vcf" |\
    grep -v -E '^##' | head -n 3

#CHROM  POS ID  REF ALT QUAL    FILTER  INFO    FORMAT  1094PC0005  1094PC0009  1094PC0012  1094PC0013
chr1    30860   .   G   C   33.46   .   AC=2;AF=0.053;AN=38;BaseQRankSum=2.327;DP=49;Dels=0.00;EFF=DOWNSTREAM(MODIFIER||||85|FAM138A|protein_coding|CODING|ENST00000417324|),DOWNSTREAM(MODIFIER|||||FAM138A|processed_transcript|CODING|ENST00000461467|),DOWNSTREAM(MODIFIER|||||MIR1302-10|miRNA|NON_CODING|ENST00000408384|),INTRON(MODIFIER|||||MIR1302-10|antisense|NON_CODING|ENST00000469289|),INTRON(MODIFIER|||||MIR1302-10|antisense|NON_CODING|ENST00000473358|),UPSTREAM(MODIFIER|||||WASH7P|unprocessed_pseudogene|NON_CODING|ENST00000423562|),UPSTREAM(MODIFIER|||||WASH7P|unprocessed_pseudogene|NON_CODING|ENST00000430492|),UPSTREAM(MODIFIER|||||WASH7P|unprocessed_pseudogene|NON_CODING|ENST00000438504|),UPSTREAM(MODIFIER|||||WASH7P|unprocessed_pseudogene|NON_CODING|ENST00000488147|),UPSTREAM(MODIFIER|||||WASH7P|unprocessed_pseudogene|NON_CODING|ENST00000538476|);FS=3.128;HRun=0;HaplotypeScore=0.6718;InbreedingCoeff=0.1005;MQ=36.55;MQ0=0;MQRankSum=0.217;QD=16.73;ReadPosRankSum=2.017 GT:AD:DP:GQ:PL  0/0:7,0:7:15.04:0,15,177    0/0:2,0:2:3.01:0,3,39   0/0:6,0:6:12.02:0,12,143    0/0:4,0:4:9.03:0,9,119
chr1    69270   .   A   G   2694.18 .   AC=40;AF=1.000;AN=40;DP=83;Dels=0.00;EFF=SYNONYMOUS_CODING(LOW|SILENT|tcA/tcG|S60|305|OR4F5|protein_coding|CODING|ENST00000335137|exon_1_69091_70008);FS=0.000;GOA=OR4F5|GO:0004984&GO:0005886&GO:0004930&GO:0016021;HRun=0;HaplotypeScore=0.0000;InbreedingCoeff=-0.0598;MQ=31.06;MQ0=0;QD=32.86   GT:AD:DP:GQ:PL  ./. ./. 1/1:0,3:3:9.03:106,9,0  1/1:0,6:6:18.05:203,18,0

VCFFilterGeneOntology

vcffiltergo reads a VCF annotated with VEP or SNPEFF, loads the data from GeneOntology and GOA and adds a filter in the FILTER column if a gene at the current genomic location is a descendant of a given GO term.
Example:
$  java -jar dist/vcffiltergo.jar I="https://raw.github.com/arq5x/gemini/master/test/test1.snpeff.vcf"  \
    CHILD_OF=GO:0005886 FILTER=MEMBRANE  |\
    grep -v "^##"   | head -n 3

#CHROM  POS ID  REF ALT QUAL    FILTER  INFO    FORMAT  1094PC0005  1094PC0009  1094PC0012  1094PC0013
chr1    30860   .   G   C   33.46   PASS    AC=2;AF=0.053;AN=38;BaseQRankSum=2.327;DP=49;Dels=0.00;EFF=DOWNSTREAM(MODIFIER||||85|FAM138A|protein_coding|CODING|ENST00000417324|),DOWNSTREAM(MODIFIER|||||FAM138A|processed_transcript|CODING|ENST00000461467|),DOWNSTREAM(MODIFIER|||||MIR1302-10|miRNA|NON_CODING|ENST00000408384|),INTRON(MODIFIER|||||MIR1302-10|antisense|NON_CODING|ENST00000469289|),INTRON(MODIFIER|||||MIR1302-10|antisense|NON_CODING|ENST00000473358|),UPSTREAM(MODIFIER|||||WASH7P|unprocessed_pseudogene|NON_CODING|ENST00000423562|),UPSTREAM(MODIFIER|||||WASH7P|unprocessed_pseudogene|NON_CODING|ENST00000430492|),UPSTREAM(MODIFIER|||||WASH7P|unprocessed_pseudogene|NON_CODING|ENST00000438504|),UPSTREAM(MODIFIER|||||WASH7P|unprocessed_pseudogene|NON_CODING|ENST00000488147|),UPSTREAM(MODIFIER|||||WASH7P|unprocessed_pseudogene|NON_CODING|ENST00000538476|);FS=3.128;HRun=0;HaplotypeScore=0.6718;InbreedingCoeff=0.1005;MQ=36.55;MQ0=0;MQRankSum=0.217;QD=16.73;ReadPosRankSum=2.017 GT:AD:DP:GQ:PL  0/0:7,0:7:15.04:0,15,177    0/0:2,0:2:3.01:0,3,39   0/0:6,0:6:12.02:0,12,143    0/0:4,0:4:9.03:0,9,119
chr1    69270   .   A   G   2694.18 MEMBRANE    AC=40;AF=1.000;AN=40;DP=83;Dels=0.00;EFF=SYNONYMOUS_CODING(LOW|SILENT|tcA/tcG|S60|305|OR4F5|protein_coding|CODING|ENST00000335137|exon_1_69091_70008);FS=0.000;HRun=0;HaplotypeScore=0.0000;InbreedingCoeff=-0.0598;MQ=31.06;MQ0=0;QD=32.86 GT:AD:DP:GQ:PL  ./. ./. 1/1:0,3:3:9.03:106,9,0  1/1:0,6:6:18.05:203,18,0


That's it,

Pierre

26 September 2011

PostScript as a Programming Language for Bioinformatics: mynotebook

"PostScript (PS) is an interpreted, stack-based programming language. It is best known for its use as a page description language in the electronic and desktop publishing areas."[wikipedia]. In this post, I'll show how I've used to create a simple and lightweight view of the genome.

Introduction: just a simple postscript program

The following PS program fills a rectangular gray shape; You can display the result using ghostview, a2ps, etc...
%!PS
newpath
50 50 moveto
0 100 rlineto
100 0 rlineto
0 -100 rlineto
closepath
0.5 setgray
fill
showpage

Some global variables

The page width

/screenWidth 1000 def

The page width

/screenHeight 1000 def

The minimum 5' position

/minChromStart 1E9 def

The maximum 3' position

/maxChromEnd -1 def

The size of a genomic feature

/featureHeight 20 def

The distance between two 'ticks' for drawing the orientation

/ticksx 20 def

The font size

/theFontSize 9 def
The variable knownGene is a PS array of genes.

/knownGene [
[(uc002zkr.3) (chr22) (-) 161242...
...]
] def

Each Gene is a PS array holding the structure of the UCSC knownGene table, that is to say: name , chromosome, txStart, txEnd, cdsStart, cdsEnd, exonStarts, exonEnds:

[(uc002zmh.2) (chr22) (-) 17618410 17646177 17618910 17646134
   [17618410 17619439 17621948 17623987 17625913 17629337 17630431 17646098 ]
   [17619247 17619628 17622123 17624021 17626007 17629450 17630635 17646177 ]
]
. a simple command line can be used to fetch those data:
%  curl -s "http://hgdownload.cse.ucsc.edu/goldenPath/hg19/database/knownGene.txt.gz" |\
gunzip -c | grep chr22 | head -n 20 |\
awk '{printf("[(%s) (%s) (%s) %s %s %s %s [%s] [%s] ]\n",$1,$2,$3,$4,$5,$6,$7,$9,$10);}' |\
tr "," " " > result.txt 

Some utilities

converting a PS object to string

/toString
{
20 string cvs 
} bind def

Converting a string to interger (loop over each character an increase the current value)

/toInteger
{
3 dict begin
/s exch def
/i 0 def
/n 0 def
s {
  n 10 mul /n exch def
  s i get 48 sub n add /n exch def %48=ascii('0')
  i 1 add /i exch def
  } forall
n % leave n on the stack
end
} bind def

Convert a genomic position to a index on the page 'x' axis

/convertPos2pixel
{
minChromStart sub maxChromEnd minChromStart sub div screenWidth mul
} bind def

Extract the chromosome (that is to say, extract the 1st element of the current array on the stack)

/getChrom
{
1 get
} bind def

Create a hyperlink to the UCSC genome browser

/getHyperLink
{
3 dict begin
/E exch def %% END
/S exch def %% START
/C exch def %% CHROMOSOME
[ (http://genome.ucsc.edu/cgi-bin/hgTracks?position=) C (:) S toString (-) E toString (&) (&db=hg19) ] concatstringarray
end
} bind def

Paint a rectangle

/box
{
4 dict begin
/height exch def
/width exch def
/y exch def
/x exch def
x y moveto
width 0 rlineto
0 height rlineto
width -1 mul 0 rlineto
0 height -1 mul rlineto
end
} bind def

Paint a gray gradient

/gradient
{
4 dict begin
/height exch def
/width exch def
/y exch def
/x exch def
/i 0 def
height 2 div /i exch def

0 1 height 2 div {
	1 i height 2.0 div div sub setgray
	newpath
	x  
	y height 2 div i sub  add
	width
	i 2 mul
	box
	closepath
	fill
	i 1 sub /i exch def
	}for
newpath
0 setgray
0.4 setlinewidth
x y width height box
closepath
stroke
end
} bind def

Methods extracting a data about the current gene on the PS stack.

Extract the transcription start:

/getTxStart
{
3 get
} bind def

Extract the transcription end:

/getTxEnd
{
4 get
} bind def

Extract the CDS start:

/getCdsStart
{
5 get
} bind def

Extract the transcription end:

/getCdsEnd
{
6 get
} bind def

Extract the strand:

/getStrand
{
2 get (+) eq {1} {-1} ifelse
} bind def
Get the gene name

/getKgName
{
0 get
} bind def

Get the number of exons:

/getExonCount
{
7 get length
} bind def

Get the start position of the i-th exon:

/getExonStart
{
2 dict begin
/i exch def
/gene exch def
gene 7 get i get
end
} bind def

Get the end position of the i-th exon:

/getExonEnd
{
2 dict begin
/i exch def
/gene exch def
gene 8 get i get
end
} bind def

Should we draw this gene on the page ?

/isVisible
{
1 dict begin
/gene exch def
minChromStart gene getTxEnd gt 
	{
	false
	}
	{
	gene getTxStart maxChromEnd gt
		{
		false
		}
		{
		true
		}ifelse
	}ifelse
end
}bind def

Methods for an array of genes

Loop over the genes and extract the lowest 5' index:

/getMinChromStart
{
3 dict begin
/genes exch def
/pos 10E9 def
/i 0 def
genes length {
	genes i get getTxStart pos min /pos  exch def
	i 1 add /i exch def
	}repeat
pos
end
} bind def

Loop over the genes and extract the highest 3' index:

/getMaxChromEnd
{
3 dict begin
/genes exch def
/pos -1E9 def
/i 0 def
genes length {
	genes i get getTxEnd pos max /pos  exch def
	i 1 add /i exch def
	}repeat
pos
end
} bind def

Painting ONE Gene

/paintGene
{
5 dict begin
/gene exch def %% the GENE argument
/midy featureHeight 2.0 div def %the middle of the row
/x0 gene getTxStart convertPos2pixel def % 5' side of the gene in pixel
/x1 gene getTxEnd convertPos2pixel def % 3' side of the gene in pixel
/i 0 def
0.1 setlinewidth

1 0 0 setrgbcolor

newpath
x0 midy moveto
x1 midy lineto
closepath
stroke


% paint ticks
0 1 x1 x0 sub ticksx div{
	newpath
	gene getStrand 1 eq 
		{
		x0 ticksHeight sub i add midy ticksHeight add moveto
		x0 i add midy lineto
		x0 ticksHeight sub i add midy ticksHeight sub lineto
		}
	%else
		{
		x0 ticksHeight add i add midy ticksHeight add moveto
		x0 i add midy lineto
		x0 ticksHeight add i add midy ticksHeight sub lineto
		} ifelse
	stroke
	i ticksx add /i exch def
	} for

%paint Transcript start-end
0 0 1 setrgbcolor
newpath
gene getCdsStart convertPos2pixel
midy cdsHeight 2 div sub
gene getCdsEnd convertPos2pixel gene getCdsStart convertPos2pixel sub 
cdsHeight box
closepath
fill

% loop over exons
0 /i exch def
gene getExonCount
	{
	gene i getExonStart convertPos2pixel
	midy exonHeight 2 div sub
	gene i getExonEnd convertPos2pixel gene i getExonStart convertPos2pixel sub
	exonHeight gradient
	i 1 add /i exch def
	} repeat
0 setgray
gene getTxEnd convertPos2pixel 10 add midy moveto
gene getKgName show

%URL 
[ /Rect [x0 0 x1 1 add featureHeight]
/Border [1 0 0]
/Color [1 0 0]
/Action << /Subtype /URI /URI gene getChrom gene getTxStart gene getTxEnd getHyperLink  >>
/Subtype /Link
/ANN pdfmark

end
} bind def

Paint all Genes

/paintGenes
{
3 dict begin
/genes exch def %the GENE argument (an array)
/i 0 def % loop iterator
/j 0 def % row iterator


% draw 10 vertical lines
i 0 /i exch def
0 setgray
0 1 10 {
	%draw a vertical line
	screenWidth 10 div i mul 0 moveto
	screenWidth 10 div i mul screenHeight lineto
	stroke
	% print the position at the top rotate by 90°
	screenWidth 10 div i mul 10 add screenHeight 5 sub moveto
	-90 rotate
	maxChromEnd minChromStart sub i 10 div mul minChromStart add toString show
	90 rotate
	i 1 add /i exch def
	} for

0 /i exch def
genes length {
	genes i get isVisible
		{
		gsave
		0 j  featureHeight 2 add mul translate
		genes i get paintGene
		j 1 add /j exch def
		grestore
		} if
	i 1 add /i exch def
	}repeat
end
} bind def

All in one: the postscript code


Open the PS file in ghostview, evince, ...

Zooming ? Yes we can.

Ghostview has an option -Sname=string
       -Sname=string
       -sname=string
              Define  a  name  in  "systemdict"  with a given string as value.
              This is different from -d.

In my postscript file, the default values for minChromStart and maxChromEnd are overridden by the user's parameters:

systemdict /userChromStart known {
	userChromStart toInteger /minChromStart  exch def
	} if

systemdict /userChromEnd known {
	userChromEnd toInteger /maxChromEnd  exch def
	} if
That's it,

Pierre

08 February 2011

Visualizing my twitter network with Zoom.it

I wrote a small Java tool to download my twitter network as a GEXF file. This tool is available on github at:


java -jar twittergraph.jar -o twittergraph.gexf 7431072 #my twitter ID


This tool doesn't use the OAuth API, so it have to wait for a few minutes, and retry to connect, every times it reaches the twitter API quotas (150 requests per hour). In the end it took one night to download the data from my network (~390 friends).

<gexf
xmlns="http://www.gexf.net/1.1draft"
xmlns:viz="http://www.gexf.net/1.1draft/viz"
xmlns:xsi="http://www.w3.org/2001/XMLSchema-instance"
version="1.1"
xsi:schemaLocation="http://www.gexf.net/1.1draft http://www.gexf.net/1.1draft/gexf.xsd">

<meta lastmodifieddate="2011-02-04">
<creator>Gephi 0.7</creator>
<description/>
</meta>
<graph defaultedgetype="directed" timeformat="double" mode="dynamic">
<attributes class="node" mode="static">
<attribute id="name" title="name" type="string"/>
<attribute id="screenName" title="screenName" type="string"/>
<attribute id="imageUrl" title="imageUrl" type="string">
<default>http://a3.twimg.com/sticky/default_profile_images/default_profile_1_reasonably_small.png</default>
</attribute>
<attribute id="location" title="location" type="string"/>
<attribute id="description" title="description" type="string"/>
<attribute id="protectedProfile" title="protectedProfile" type="boolean"/>
<attribute id="friends" title="friends" type="integer"/>
<attribute id="followers" title="followers" type="integer"/>
<attribute id="listed" title="listed" type="integer"/>
<attribute id="utc_offset" title="utc offset" type="integer"/>
<attribute id="statuses_count" title="statuses count" type="integer"/>
</attributes>
<nodes>
<node id="6612402" label="sciencebase">
<attvalues>
<attvalue for="name" value="David Bradley"/>
<attvalue for="screenName" value="sciencebase"/>
<attvalue for="imageUrl" value="http://a3.twimg.com/profile_images/1142396198/twitter-blue-bradley_normal.jpg"/>
<attvalue for="location" value="Cambridge, UK"/>
<attvalue for="description" value="Science Writer David Bradley based in Cambridge, UK. Physical and life sciences news and views + technology, internet, web commentary."/>
<attvalue for="protectedProfile" value="false"/>
<attvalue for="friends" value="2022"/>
<attvalue for="followers" value="9197"/>
<attvalue for="listed" value="1065"/>
<attvalue for="utc_offset" value="0"/>
<attvalue for="statuses_count" value="7526"/>
</attvalues>
</node>
<node id="19344270" label="EMBOcomm">
<attvalues>
<attvalue for="name" value="Suzanne Beveridge"/>
<attvalue for="screenName" value="EMBOcomm"/>
<attvalue for="imageUrl" value="http://a0.twimg.com/profile_images/1189685782/S_Beveridge5100_normal.JPG"/>
<attvalue for="location" value="Heidelberg"/>
<attvalue for="description" value="Follow me for the latest from EMBO, the European Molecular Biology Organization"/>
<attvalue for="protectedProfile" value="false"/>
<attvalue for="friends" value="396"/>
<attvalue for="followers" value="697"/>
<attvalue for="listed" value="59"/>
<attvalue for="utc_offset" value="3600"/>
<attvalue for="statuses_count" value="632"/>
</attvalues>
</node>
<node id="20153702" label="walshtp">
<attvalues>
<attvalue for="name" value="Tom Walsh"/>
<attvalue for="screenName" value="walshtp"/>
<attvalue for="imageUrl" value="http://a3.twimg.com/profile_images/644287976/IMG_0815_normal.JPG"/>
<attvalue for="location" value="Dundee, Scotland"/>
<attvalue for="description" value="Scientific programmer and sysadmin. "/>
<attvalue for="protectedProfile" value="false"/>
<attvalue for="friends" value="129"/>
<attvalue for="followers" value="99"/>
<attvalue for="listed" value="8"/>
<attvalue for="utc_offset" value="0"/>
<attvalue for="statuses_count" value="783"/>
</attvalues>
</node>
<node id="15150655" label="konradfoerstner">
<attvalues>
<attvalue for="name" value="Konrad Förstner"/>
<attvalue for="screenName" value="konradfoerstner"/>
<attvalue for="imageUrl" value="http://a3.twimg.com/profile_images/643611092/konrad_avantar2_normal.jpeg"/>
<attvalue for="location" value="here and there"/>
<attvalue for="description" value="Idealist, Scientist, Includist, Data analyst, Open Source|Data|Access, Coder, Command line friend, CouchSurfer, Konrad"/>
<attvalue for="protectedProfile" value="false"/>
<attvalue for="friends" value="266"/>
<attvalue for="followers" value="167"/>
<attvalue for="listed" value="17"/>
<attvalue for="utc_offset" value="3600"/>
<attvalue for="statuses_count" value="1948"/>
</attvalues>
</node>

(...)

<edge id="E3811" source="14899756" target="14295341">
<attvalues>
<attvalue for="weight" value="1.0"/>
</attvalues>
</edge>
<edge id="E4816" source="14899756" target="19542750">
<attvalues>
<attvalue for="weight" value="1.0"/>
</attvalues>
</edge>
<edge id="E4830" source="14899756" target="60065276">
<attvalues>
<attvalue for="weight" value="1.0"/>
</attvalues>
</edge>
<edge id="E339" source="14899756" target="617133">
<attvalues>
<attvalue for="weight" value="1.0"/>
</attvalues>
</edge>
<edge id="E4807" source="14899756" target="15276911">
<attvalues>
<attvalue for="weight" value="1.0"/>
</attvalues>
</edge>
<edge id="E4822" source="14899756" target="26506721">
<attvalues>
<attvalue for="weight" value="1.0"/>
</attvalues>
</edge>
<edge id="E4824" source="14899756" target="27023131">
<attvalues>
<attvalue for="weight" value="1.0"/>
</attvalues>
</edge>
<edge id="E4819" source="14899756" target="22406785">
<attvalues>
<attvalue for="weight" value="1.0"/>
</attvalues>
</edge>
<edge id="E4808" source="14899756" target="16170580">
<attvalues>
<attvalue for="weight" value="1.0"/>
</attvalues>
</edge>
<edge id="E1237" source="14899756" target="4339911">
<attvalues>
<attvalue for="weight" value="1.0"/>
</attvalues>
</edge>
<edge id="E4828" source="14899756" target="56564230">
<attvalues>
<attvalue for="weight" value="1.0"/>
</attvalues>
</edge>
<edge id="E4826" source="14899756" target="33838201">
<attvalues>
<attvalue for="weight" value="1.0"/>
</attvalues>
</edge>
<edge id="E4815" source="14899756" target="19002481">
<attvalues>
<attvalue for="weight" value="1.0"/>
</attvalues>
</edge>
</edges>
</graph>
</gexf>


The GEXF file was then opened with Gephi, processed with the ForceAtlas algorithm and exported as a PDF file.

The PDF file was uploaded on scribd: http://www.scribd.com/doc/48415306/My-Twitter-Network


I then, downloaded the PDF from scribd.com, quickly copied the URL of the generated PDF and pasted it into http://zoom.it/.

Here is the result ! :-)


That's it !

Pierre

03 February 2011

Using the #Gephi toolkit to draw a graph from PSI-MI data, my notebook

GEPHI, interactive visualization and exploration platform for all kinds of networks and complex systems, dynamic and hierarchical graphs. Recently, a java library , the Gephi toolkit has been released and was used by LinkedIn for generating its inMaps.

I've been playing with the Toolkit, to generate a graph from a PSI-MI file downloaded from EMBL-Strings. The source code is available on github:


Shortly: the program reads the PSIMI-XML, uses XPATH to find the nodes and the edges, creates the graph (I could also have used XSLT too, to create an internal GEXF (the native file format for Gephi) file from the PIS-MI file), applies a layout algorithm (YifanHuLayout) and outputs the result (SVG, PDF, GEXF... ). Nevertheless it was not clear how I could change the output to insert a hyperlink, to change the background color, etc... The online javadoc was missing many informations.

Compilation

javac -cp /path/to/gephi-toolkit.jar -sourcepath src -d src src/sandbox/PsimiWithGephi.java

Generating a PDF for HOPX

I've downloaded the psi-mi.xml for HOPX from the embl-strings database and run the program.
java -cp /path/to/gephi-toolkit.jar:src sandbox.PsimiWithGephi -o ~/result.pdf file.xml

Result


Viewing the result with Flash

The API can export a GEXF file too and it can be visualized using a flash application named GEXF Explorer:

Note: "Sigma" is another viewer available for gexf: http://ofnodesandedges.com/sigma-neighborhoods-exploration/

That's it,

Pierre