A Java implementation of Jan Aerts' LocusTree
This post is a description of my implementation of Jan Aerts' LocusTree algorithm (I want to thank Jan, our discussion and his comments were as great source of inspiration) based on BerkeleyDB-JE, a Key/Value datastore. This implementation has been used to build a genome browser displaying its data with the SVG format. In brief: splicing each chromosome using a dichotomic approach allows to quickly find all the features in a given genomic region for a given resolution. A count of the total number of objects in the descent of each child node is used to produce a histogram of the number of objects smaller than the given resolution.
The organisms are loaded in the database using a simple XML file:
The chromosomes are loaded in the database using a simple XML file:
The descriptions of the tracks are loaded in the database using a simple XML file:
Each LocusTree Node (LTNode) is linked to a Chromosome and a Track using a database named 'TrackChrom'. Here the Key of the BerkeleyDB is a composite key (chromosome/track).
The structure of a LTNode is described below. Each node contains a link to its parent, the links to its children as well as a set of genomic entities whose length is greater or equals that 'this.length'.
To load the content of each LocusTree, I've defined a simple java interface called LTStreamLoader which looks like this:
 Later, I've added some labels.
 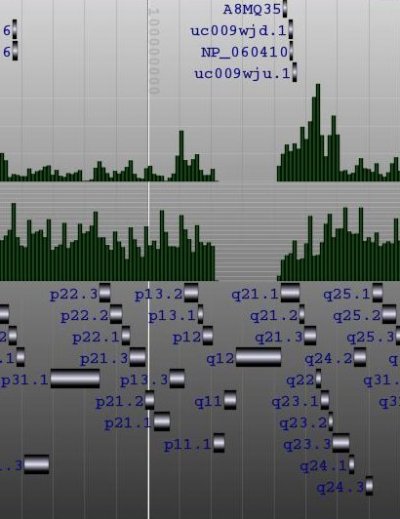 And my latest version uses the JSON metadata available in each objet to display the spliced structure of the genes:
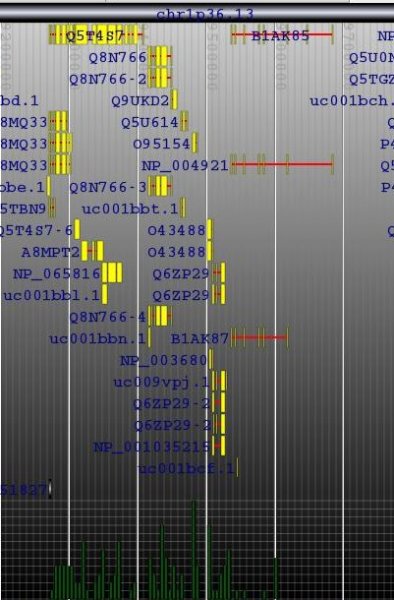 The browser is fast (sorry, I cannot show it at this time) but I need to play with the config of BerkeleyDB to speed up the insertions and reduce the size of the database.
That's it.
Pierre
NB: The figures of this post were created using SVGToCanvas.
JSON/Metadata
All the information is stored in BerkeleyDB and I've used JSON to add some metadata about each object. The JSON is serialized, gzipped and stored in BerkeleyDB.Organism
Each organism is defined by an ID and a Name. The Key of the BerkeleyDB is the organism.id.The organisms are loaded in the database using a simple XML file:
<organisms>
<organism id="36">
<name>hg18</name>
<description>Human Genome Build v.36</description>
<metadata>{"taxon-id":9606}</metadata>
</organism>
</organisms>
<organism id="36">
<name>hg18</name>
<description>Human Genome Build v.36</description>
<metadata>{"taxon-id":9606}</metadata>
</organism>
</organisms>
Chromosome
Each chromosome is defined by an ID, a Name, its length and its organism-ID. The Key in berkeleyDB is the chromosome ID.The chromosomes are loaded in the database using a simple XML file:
<chromosomes organism-id="36">
<chromosome id="1">
<name>chr1</name>
<metadata>{"size":247249719,"type":"autosomal"}</metadata>
</chromosome>
<chromosome id="10">
<name>chr10</name>
<metadata>{"size":135374737,"type":"autosomal"}</metadata>
</chromosome>
(...)
</chromosomes>
<chromosome id="1">
<name>chr1</name>
<metadata>{"size":247249719,"type":"autosomal"}</metadata>
</chromosome>
<chromosome id="10">
<name>chr10</name>
<metadata>{"size":135374737,"type":"autosomal"}</metadata>
</chromosome>
(...)
</chromosomes>
Track
Each track is defined by an ID and a Name. The Key in berkeleyDB is the track ID.The descriptions of the tracks are loaded in the database using a simple XML file:
<tracks>
<track id="1">
<name>cytobands</name>
<description>UCSC cytobands</description>
</track>
<track id="2">
<name>knownGene</name>
<description>UCSC knownGene</description>
</track>
<track id="3">
<name>snp130</name>
<description>dbSNP v.130</description>
</track>
<track id="4">
<name>snp130Coding</name>
<description>UCSC coding Snp</description>
</track>
<track id="5">
<name>all_mrna</name>
<description>UCSC All mRNA</description>
</track>
</tracks>
Nodes
Each LocusTree Node (LTNode) is linked to a Chromosome and a Track using a database named 'TrackChrom'. Here the Key of the BerkeleyDB is a composite key (chromosome/track).
The structure of a LTNode is described below. Each node contains a link to its parent, the links to its children as well as a set of genomic entities whose length is greater or equals that 'this.length'.
To load the content of each LocusTree, I've defined a simple java interface called LTStreamLoader which looks like this:
public interface LTLoader
{
public MappedObject getMappedObject();
public String getChromosome();
public Set<String> getKeywords();
}
public interface LTStreamLoader
extends LTLoader
{
public void open(String uri) throws IOException;
public void close() throws IOException;
public boolean next() throws IOException;
}
An instance of this interface is used to load the content of a tab delimited file as defined in the following XML file:{
public MappedObject getMappedObject();
public String getChromosome();
public Set<String> getKeywords();
}
public interface LTStreamLoader
extends LTLoader
{
public void open(String uri) throws IOException;
public void close() throws IOException;
public boolean next() throws IOException;
}
<loaders>
<load organism-id="36" track-id="5" class-loader="fr.cephb.locustree.loaders.UCSCAllMrnaLoader" limit="10000">
http://hgdownload.cse.ucsc.edu/goldenPath/hg18/database/all_mrna.txt.gz
</load>
<load organism-id="36" track-id="4" class-loader="fr.cephb.locustree.loaders.UCSCSnpCodingLoader" limit="10000">
http://hgdownload.cse.ucsc.edu/goldenPath/hg18/database/snp130CodingDbSnp.txt.gz
</load>
<load organism-id="36" track-id="1" class-loader="fr.cephb.locustree.loaders.UCSCCytoBandsLoader">
http://hgdownload.cse.ucsc.edu/goldenPath/hg18/database/cytoBand.txt.gz
</load>
<load organism-id="36" track-id="2" class-loader="fr.cephb.locustree.loaders.UCSCKnownGeneLoader">
http://hgdownload.cse.ucsc.edu/goldenPath/hg18/database/knownGene.txt.gz
</load>
<load organism-id="36" track-id="3" class-loader="fr.cephb.locustree.loaders.UCSCSnpLoader" limit="10000">
http://hgdownload.cse.ucsc.edu/goldenPath/hg18/database/snp130.txt.gz
</load>
</loaders>
It took about 3H00 to load 'snp130.txt.gz' and the size of the indexed BerkeleyDB/LocusTree database was 16Go (ouch!).<load organism-id="36" track-id="5" class-loader="fr.cephb.locustree.loaders.UCSCAllMrnaLoader" limit="10000">
http://hgdownload.cse.ucsc.edu/goldenPath/hg18/database/all_mrna.txt.gz
</load>
<load organism-id="36" track-id="4" class-loader="fr.cephb.locustree.loaders.UCSCSnpCodingLoader" limit="10000">
http://hgdownload.cse.ucsc.edu/goldenPath/hg18/database/snp130CodingDbSnp.txt.gz
</load>
<load organism-id="36" track-id="1" class-loader="fr.cephb.locustree.loaders.UCSCCytoBandsLoader">
http://hgdownload.cse.ucsc.edu/goldenPath/hg18/database/cytoBand.txt.gz
</load>
<load organism-id="36" track-id="2" class-loader="fr.cephb.locustree.loaders.UCSCKnownGeneLoader">
http://hgdownload.cse.ucsc.edu/goldenPath/hg18/database/knownGene.txt.gz
</load>
<load organism-id="36" track-id="3" class-loader="fr.cephb.locustree.loaders.UCSCSnpLoader" limit="10000">
http://hgdownload.cse.ucsc.edu/goldenPath/hg18/database/snp130.txt.gz
</load>
</loaders>
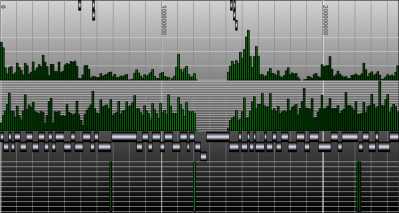
Building the Genome Browser
The locus tree database was used to create (yet another) Genome Browser. My current implementation runs smoothly under Apache Tomcat. The SVG vectorial format was used to draw and hyperlink the data. Here is a screenshot of the first version I wrote one week ago. As you can see, the objects that were too small to be drawn, were displayed within a histogram.That's it.
Pierre
NB: The figures of this post were created using SVGToCanvas.

No comments:
Post a Comment