11 August 2010

Mwncbi, a mediawiki extension loading asynchronously some records from the NCBI

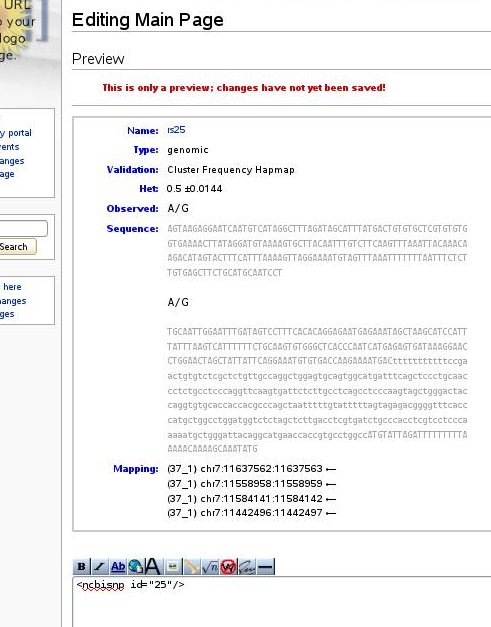
I've just created new extension for mediawiki. This extension creates a new handler for three new tags :<ncbigene/> , <ncbisnp> and <ncbipubmed>.

Each of those tags download asynchronously a XML record from the NCBI (Gene, NCBI Pubmed or dbSNP) using NCBI-EFetch. The XML is then transformed to HTML on the client side using a XSLT transformation and inserted in the mediawiki page. (As the XSLT processor is specific from Firefox I'm afraid this extension won't run for the other browsers ). As I'm using XSLT, the stylesheets are easily modifiable and hence, the HTML rendering is truly customizable.

The source code is available on github: http://github.com/lindenb/mw4bio/

The installation was described on Mediawiki.org: http://www.mediawiki.org/wiki/Extension:Mwncbi.

Screenshots


Gene


Pubmed


DBSNP


That's it

Pierre

06 August 2010

A MediaWiki extension displaying the UCSC Genome Browser

Today I wrote an extension for mediawiki displaying an HTML <iframe/> to the UCSC Genome Browser. This extension will help my colleagues to annotate some candidate genes threw our local wiki.

This extension handles a new tag <ucsciframe> composed of three required parameters: 'chrom', 'start' and 'end'.

For example
<ucsciframe chrom="chr2" start="98987" end="9879899"/>
The source code for this extension is available at:and its documentation is available on www.mediawiki.org.

That's it !

Pierre

04 August 2010

A Tiny Genome Browser (XHTML/Javascript/json/svg)

I'm currently working on a small set of NGS data and all I need is a simple genome browser to display my mutations while being able to select some SNPs according to some criteria (is it a known rs## , what is the prediction with SIFT or/and Polyphen ?, etc... ). As it is a relative small amount of data, it can be embedded in a webpage without needing a web server.

First, I need a description of the genes as JSON: I described yesterday how I generated this file using mysql, XSLT and the data from the UCSC:

var knownGenes=[{"name":"uc001aaa.3","chrom":"chr1","strand":"+","txStart":11873,"txEnd":14409,"cdsStart":11873,"cdsEnd":11873,"exonCount":3,"exonStarts":[11873,12612,13220],"exonEnds":[12227,12721,14409],"proteinID":"","alignID":"uc001aaa.3"}
,{"name":"uc010nxq.1","chrom":"chr1","strand":"+","txStart":11873,"txEnd":14409,"cdsStart":12189,"cdsEnd":13639,"exonCount":3,"exonStarts":[11873,12594,13402],"exonEnds":[12227,12721,14409],"proteinID":"B7ZGX9","alignID":"uc010nxq.1"}
,{"name":"uc010nxr.1","chrom":"chr1","strand":"+","txStart":11873,"txEnd":14409,"cdsStart":11873,"cdsEnd":11873,"exonCount":3,"exonStarts":[11873,12645,13220],"exonEnds":[12227,12697,14409],"proteinID":"","alignID":"uc010nxr.1"},
(...)];


Second, I need a JSON description of my data:
/** these are ==RANDOM== data */
var variations=[
{"chrom":"chr1","start":12874,"end":12875,"ref":"A","alt":"G","struct":false,"depth":8,"sift":"TOLERATED","pph2div":"benign","pph2var":"benign","rs":null,"hq":true,"id":0},
{"chrom":"chr1","start":792398,"end":792399,"ref":"A","alt":"G","struct":false,"depth":89,"sift":"TOLERATED","pph2div":"probably damaging","pph2var":"benign","rs":null,"hq":true,"id":1},
{"chrom":"chr1","start":959761,"end":959762,"ref":"A","alt":"G","struct":false,"depth":76,"sift":"DAMAGING","pph2div":"probably damaging","pph2var":"benign","rs":null,"hq":true,"id":2}
,(...)];

Third, I wrote a small genome browser using javascript , displaying the data as SVG and using the two previous files. Here is a screenshot:


I posted a random sample of the files on http://gist.github.com/508676, feel free to play with it.

That's it
Pierre

03 August 2010

Curvilnear perspective

I've always been fascinated by Albert Flocon's book about Curvilinear Perspective.

I started the article in the french wikipedia and I've searched for a long time how to generate those figures. The solution was rather simple simple: For a point with the 3D coordinates:
(x0,y0,z0)
. Then, in a curvilinear perspective
dist=sqrt(x1^2 + y1^2 + z1^2)

x=x1/dist
y=y1/dist
I can now generate my own drawings! :-)

Using a curvilinear perspective...
>
... or using a classical vanishing point.

That's it,

Pierre

Creating a TAR file in C++

I just wrote a C++ class creating a Tar file. The source code is available at:http://github.com/.../tarball.h. Creating such archive is useful when a web server should return a set of files or when a tool generates a whole bunch of files.

Example

~> g++ -Wall -I ${PATH_TO_SRC}/cclindenb/src/core
tarfile.cpp
~> ./a.out
~> tar tvf archive.tar
-rw-r--r-- pierre/users 14 2010-08-03 20:50 myfiles/item1.txt
-rw-r--r-- pierre/users 14 2010-08-03 20:50 myfiles/item2.txt
-rw-r--r-- pierre/users 692 2010-08-03 20:50 myfiles/code.cpp

tar xvf archive.tar --to-stdout myfiles/item1.txt 2> /dev/null
Hello World 1


That's it,
Pierre

Transforming mysql results to JSON using XSLT

The option '-X' of mysql produces a XML output:

mysql --user=genome --host=genome-mysql.cse.ucsc.edu -A \
-e 'select * from knownGene where chrom="chr1" limit 2' -X -D hg19

<?xml version="1.0"?>
<resultset statement="select * from knownGene where chrom=&quot;chr1&quot; limit 2
" xmlns:xsi="http://www.w3.org/2001/XMLSchema-instance">
<row>
<field name="name">uc001aaa.3</field>
<field name="chrom">chr1</field>
<field name="strand">+</field>
<field name="txStart">11873</field>
<field name="txEnd">14409</field>
<field name="cdsStart">11873</field>
<field name="cdsEnd">11873</field>
<field name="exonCount">3</field>
<field name="exonStarts">11873,12612,13220,</field>
<field name="exonEnds">12227,12721,14409,</field>
<field name="proteinID"></field>
<field name="alignID">uc001aaa.3</field>
</row>

<row>
<field name="name">uc010nxq.1</field>
<field name="chrom">chr1</field>
<field name="strand">+</field>
<field name="txStart">11873</field>
<field name="txEnd">14409</field>
<field name="cdsStart">12189</field>
<field name="cdsEnd">13639</field>
<field name="exonCount">3</field>
<field name="exonStarts">11873,12594,13402,</field>
<field name="exonEnds">12227,12721,14409,</field>
<field name="proteinID">B7ZGX9</field>
<field name="alignID">uc010nxq.1</field>
</row>
</resultset>
I wrote a simple xslt stylesheet transforming this XML to JSON so I can easily use those sql results in a dynamic HTML page. The stylesheet is available at:

Example

:
mysql --user=genome --host=genome-mysql.cse.ucsc.edu -A \
-e 'select * from knownGene where chrom="chr1" limit 2' > query.xml
xsltproc sql2json.xsl query.xml
[
{
"name":"uc001aaa.3",
"chrom":"chr1",
"strand":"+",
"txStart":11873,
"txEnd":14409,
"cdsStart":11873,
"cdsEnd":11873,
"exonCount":3,
"exonStarts":"11873,12612,13220,",
"exonEnds":"12227,12721,14409,",
"proteinID":"",
"alignID":"uc001aaa.3"
},
{
"name":"uc010nxq.1",
"chrom":"chr1",
"strand":"+",
"txStart":11873,
"txEnd":14409,
"cdsStart":12189,
"cdsEnd":13639,
"exonCount":3,
"exonStarts":"11873,12594,13402,",
"exonEnds":"12227,12721,14409,",
"proteinID":"B7ZGX9",
"alignID":"uc010nxq.1"
}]
The stylesheet uses two optional parameters: var=name defines a javascript variable named 'var' and ucsc=true interprets some fields from the UCSC database: for example 'exonStarts' will be treated as an array of integers.
xsltproc --stringparam var genes --stringparam ucsc true sql2json.xsl query.xml
var genes=[
{
"name":"uc001aaa.3",
"chrom":"chr1",
"strand":"+",
"txStart":11873,
"txEnd":14409,
"cdsStart":11873,
"cdsEnd":11873,
"exonCount":3,
"exonStarts":[11873,12612,13220],
"exonEnds":[12227,12721,14409],
"proteinID":"",
"alignID":"uc001aaa.3"
},
{
"name":"uc010nxq.1",
"chrom":"chr1",
"strand":"+",
"txStart":11873,
"txEnd":14409,
"cdsStart":12189,
"cdsEnd":13639,
"exonCount":3,
"exonStarts":[11873,12594,13402],
"exonEnds":[12227,12721,14409],
"proteinID":"B7ZGX9",
"alignID":"uc010nxq.1"
}
];


That's it,
Pierre