Data Visualization: gapminder
If you're looking for a new way to visualize interactively your microarray data, have a glance at the charts from Gapminder (hosted at tools.google.com)
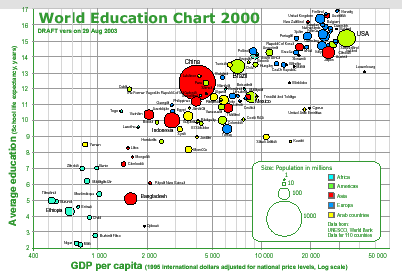
If you're looking for a new way to visualize interactively your microarray data, have a glance at the charts from Gapminder (hosted at tools.google.com)
Publié par
Pierre Lindenbaum
at
11:12 PM
![]()

1 comment:
Hi
I found your suggestion very interesting indeed; I was looking to do just that. Currently my interest is in comparative genomics of germline genes. Basically, I want to compare (and contrast) the germ line with the soma and trace it through evolution. This means dealing with several different species, tissues and genes at the same time. In addition I have phenotype data for several organisms that I’d like to incorporate in the hope that it throws some light on the functional relatedness of genes. Do you have any thoughts on how I might go about these data in different dimensions? Do you know of any studies that have used such visualization techniques for meta-analysis of genome-wide data?
Any other comments/ suggestions are welcome
Ramona BRITTO
Rennes, France.
PS. Cool blog!
Post a Comment