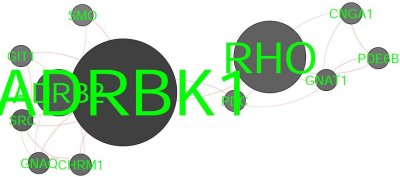
I've been playing with the Toolkit, to generate a graph from a PSI-MI file downloaded from EMBL-Strings. The source code is available on github:
Shortly: the program reads the PSIMI-XML, uses XPATH to find the nodes and the edges, creates the graph (I could also have used XSLT too, to create an internal GEXF (the native file format for Gephi) file from the PIS-MI file), applies a layout algorithm (YifanHuLayout) and outputs the result (SVG, PDF, GEXF... ). Nevertheless it was not clear how I could change the output to insert a hyperlink, to change the background color, etc... The online javadoc was missing many informations.
Compilation
javac -cp /path/to/gephi-toolkit.jar -sourcepath src -d src src/sandbox/PsimiWithGephi.java
Generating a PDF for HOPX
I've downloaded the psi-mi.xml for HOPX from the embl-strings database and run the program.java -cp /path/to/gephi-toolkit.jar:src sandbox.PsimiWithGephi -o ~/result.pdf file.xml
Result
Viewing the result with Flash
The API can export a GEXF file too and it can be visualized using a flash application named GEXF Explorer:Note: "Sigma" is another viewer available for gexf: http://ofnodesandedges.com/sigma-neighborhoods-exploration/
That's it,
Pierre


No comments:
Post a Comment